一、 Prometheus安装
1.1 安装环境: 二进制安装
      系统环境:CentOS 7
      监控系统:Prometheus 2.30
      下载:https://github.com/prometheus/prometheus/releases/download/v2.30.0-rc.0/prometheus-2.30.0-rc.0.linux-amd64.tar.gz
1.2 创建安装目录
mkdir -p /usr/local/prometheus
下载二进制包
wget https://github.com/prometheus/prometheus/releases/download/v2.30.0-rc.0/prometheus-2.30.0-rc.0.linux-amd64.tar.gz
解压
tar zxf  prometheus-2.30.0-rc.0.linux-amd64.tar.gz
mv prometheus-2.30.0-rc.0.linux-amd64/* /usr/local/prometheus
1.3 检查安装环境
[root@C20210910156669 prometheus]# /usr/local/prometheus/prometheus --version
        prometheus, version 2.30.0-rc.0 (branch: HEAD, revision: 05a816bfb739b3841acd82bd285bfb5dfec7bfd7)
          build user:       root@438506e6c112
          build date:       20210909-13:31:07
          go version:       go1.17
          platform:         linux/amd64
1.4 启动 Prometheus
[root@C20210910156669 prometheus]# ./prometheus
        level=info ts=2021-09-14T04:02:42.295Z caller=main.go:400 msg="No time or size retention was set so using the default time retention" duration=15d
        level=info ts=2021-09-14T04:02:42.295Z caller=main.go:438 msg="Starting Prometheus" version="(version=2.30.0-rc.0, branch=HEAD, revision=05a816bfb739b3841acd82bd285bfb5dfec7bfd7)"
        level=info ts=2021-09-14T04:02:42.296Z caller=main.go:443 build_context="(go=go1.17, user=root@438506e6c112, date=20210909-13:31:07)"
        level=info ts=2021-09-14T04:02:42.296Z caller=main.go:444 host_details="(Linux 3.10.0-123.el7.x86_64 #1 SMP Mon Jun 30 12:09:22 UTC 2014 x86_64 C20210910156669 (none))"
        level=info ts=2021-09-14T04:02:42.296Z caller=main.go:445 fd_limits="(soft=65535, hard=65535)"
        level=info ts=2021-09-14T04:02:42.296Z caller=main.go:446 vm_limits="(soft=unlimited, hard=unlimited)"
        level=info ts=2021-09-14T04:02:42.302Z caller=web.go:541 component=web msg="Start listening for connections" address=0.0.0.0:9090
        level=info ts=2021-09-14T04:02:42.303Z caller=main.go:822 msg="Starting TSDB ..."
        level=info ts=2021-09-14T04:02:42.304Z caller=tls_config.go:191 component=web msg="TLS is disabled." http2=false
        level=info ts=2021-09-14T04:02:42.308Z caller=head.go:466 component=tsdb msg="Replaying on-disk memory mappable chunks if any"
        level=info ts=2021-09-14T04:02:42.308Z caller=head.go:500 component=tsdb msg="On-disk memory mappable chunks replay completed" duration=19.586µs
        level=info ts=2021-09-14T04:02:42.308Z caller=head.go:506 component=tsdb msg="Replaying WAL, this may take a while"
        level=info ts=2021-09-14T04:02:42.310Z caller=head.go:577 component=tsdb msg="WAL segment loaded" segment=0 maxSegment=0
        level=info ts=2021-09-14T04:02:42.310Z caller=head.go:583 component=tsdb msg="WAL replay completed" checkpoint_replay_duration=39.16µs wal_replay_duration=1.546855ms total_replay_duration=1.628504ms
        level=info ts=2021-09-14T04:02:42.312Z caller=main.go:849 fs_type=EXT4_SUPER_MAGIC
        level=info ts=2021-09-14T04:02:42.312Z caller=main.go:852 msg="TSDB started"
        level=info ts=2021-09-14T04:02:42.312Z caller=main.go:979 msg="Loading configuration file" filename=prometheus.yml
        level=info ts=2021-09-14T04:02:42.343Z caller=main.go:1016 msg="Completed loading of configuration file" filename=prometheus.yml totalDuration=31.086878ms db_storage=1.055µs remote_storage=17.593µs web_handler=1.1µs query_engine=1.225µs scrape=30.125909ms scrape_sd=210.09µs notify=114.766µs notify_sd=42.267µs rules=19.947µs
        level=info ts=2021-09-14T04:02:42.343Z caller=main.go:794 msg="Server is ready to receive web requests."
1.5 Prometheus默认端口: 9090
http://IP:9090


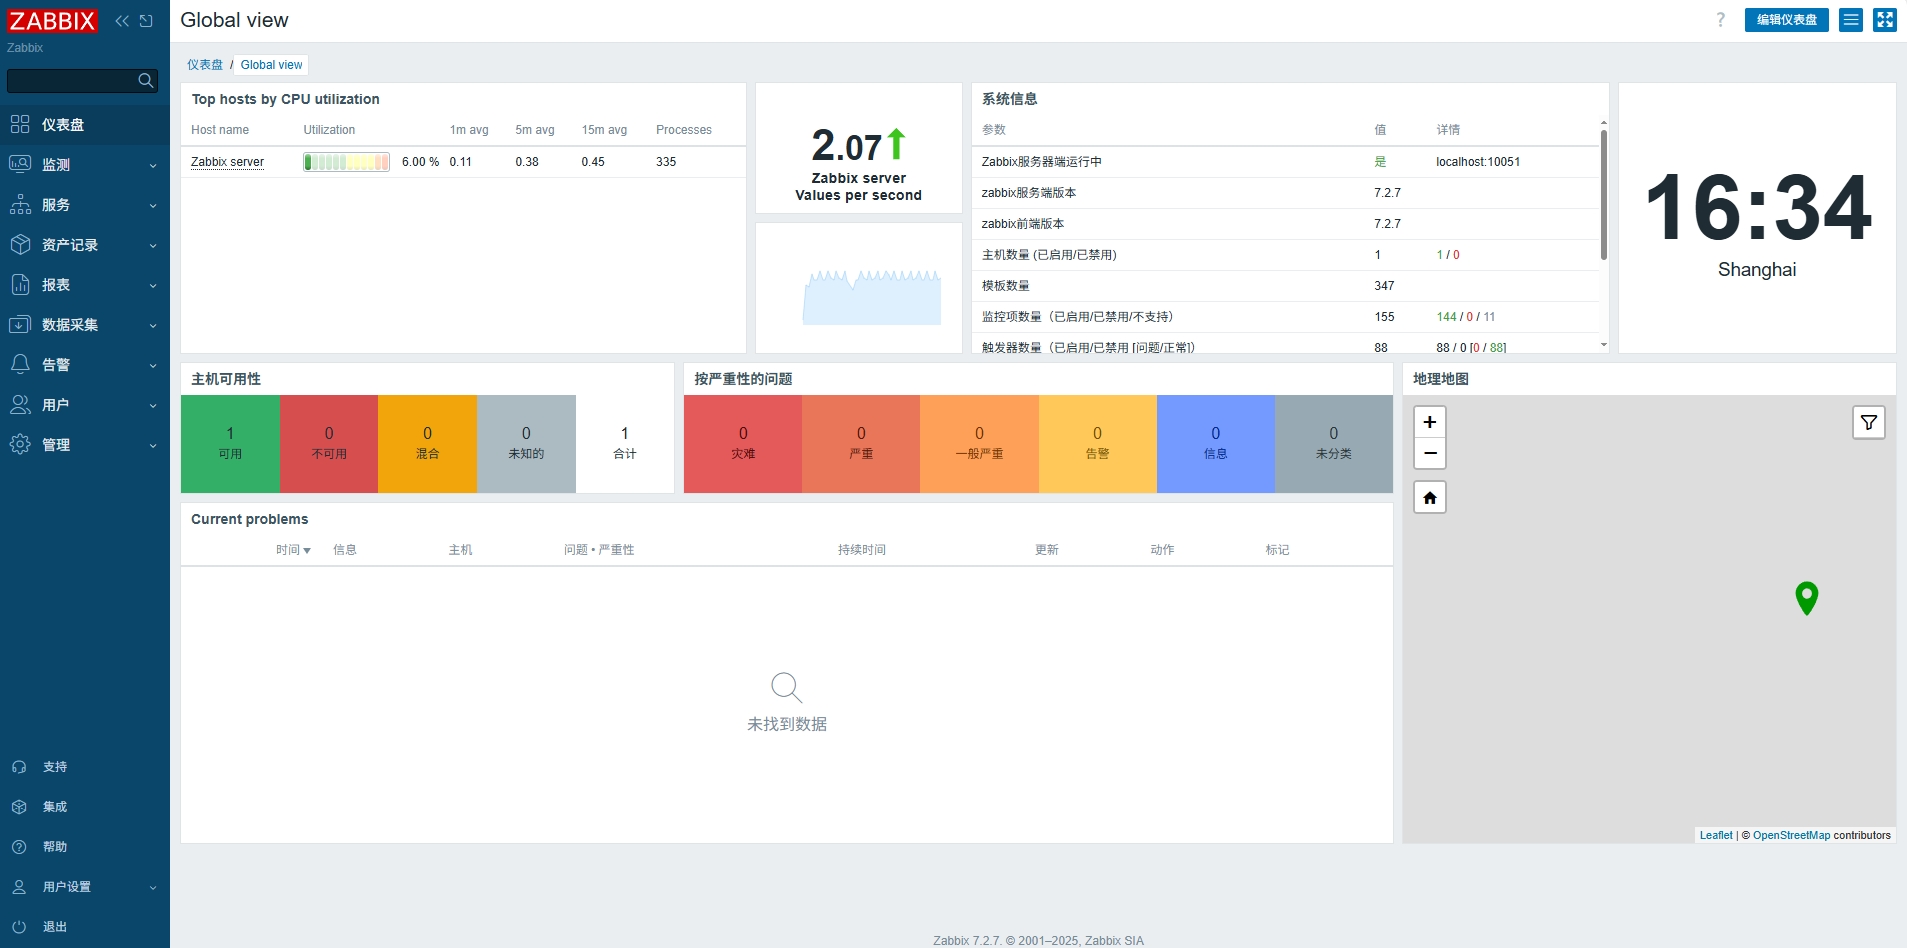


和zabbix比哪个好用些呢